Get Advanced Analytics simplified: Dive deeper into stock analysis without losing hours in research.
50% off on StockEdge PRO Yearly Plan | PROMO CODE - DIWALI50
In case of any queries or questions,
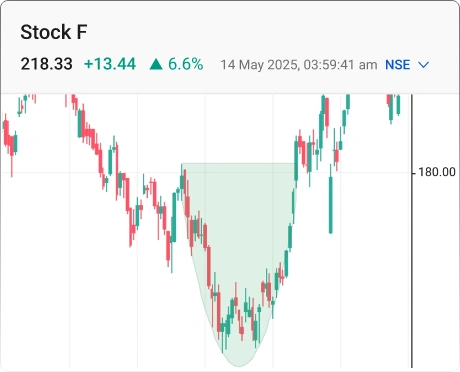
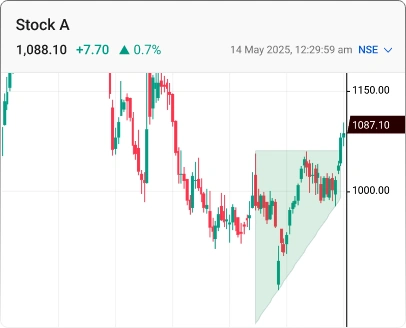
Why Chart Patterns ?
Stocks through Chart patterns predict breakout growth or decline based on supply and demand. Many Winning stocks have a history of showing patterns from time to time.
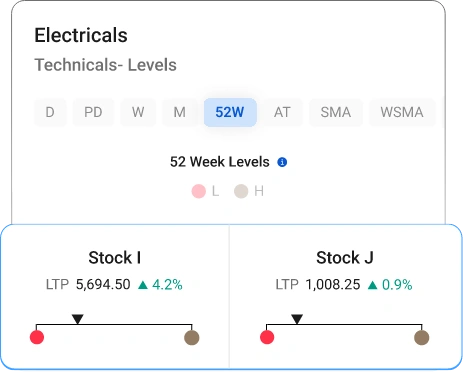
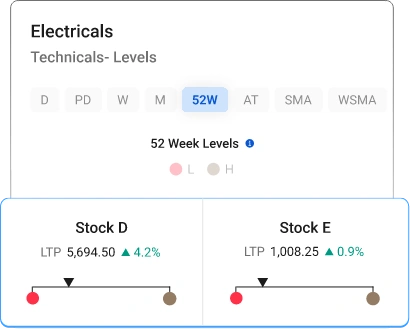
Enhance your peer analysis with key technical levels & indicators.
Pick the right stock within a specific sector, comparing valuable data points.
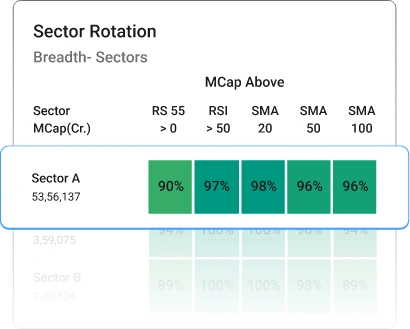
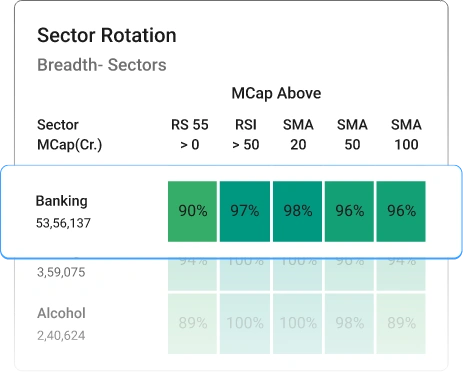
Dig deeper to analyze top industries & stocks in different sectors.
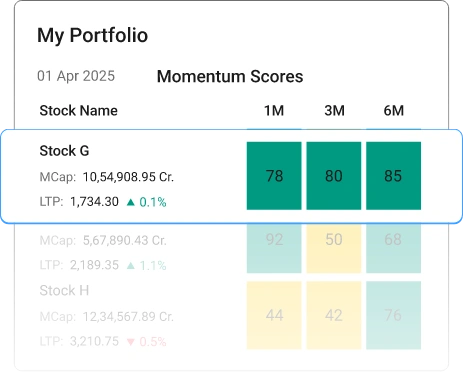
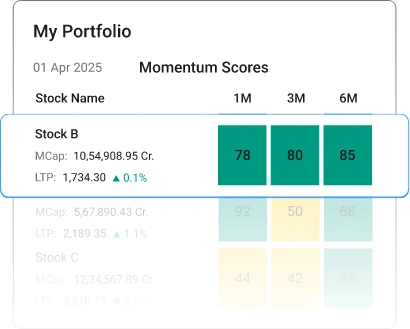
Identify the strength and momentum of stocks with top-down investment technique.
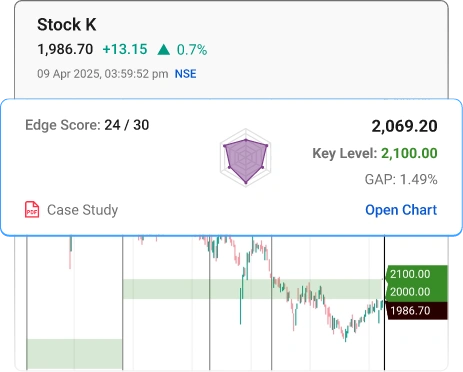
List of quality stocks trading near key levels. This Key Level assists you in identification of entry and exit points in a particular stock. Identified by our experienced in-house research team on the basis of multiple Fundamental Parameters.
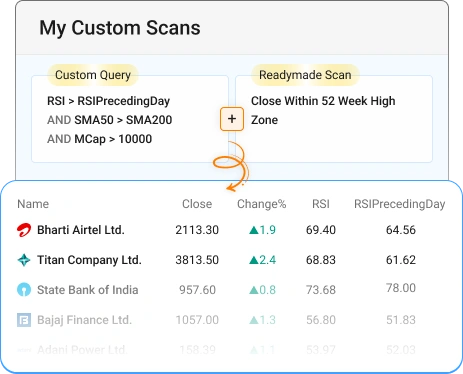
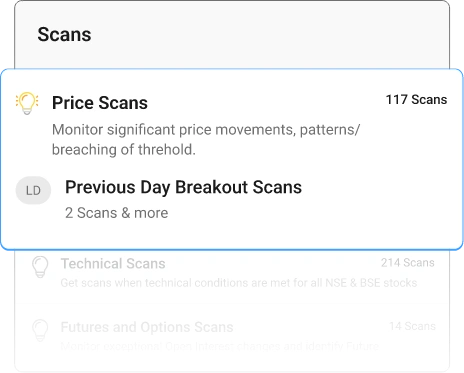
Pre-defined screeners to filter out stocks that matches users' requirement. Designed by experienced StockEdge Research Analysts. Access to premium multiple scans like Fundamental, Technical, Volume, Delivery, Futures & Options, Candlestick Scans and many more.
Detailed report on stock performance across various fundamental parameters like Growth, Profitability, Valuation, and more prepared by a team of StockEdge research analysts. The stock is scored on the basis of the above parameters that provide information on the quality of the stocks.
Summary of the conference call held by the company management to keep investors updated on past financial and operational performances and future prospects. You also get a Sentiment Score for each Concall Analysis ranging from -1 to +1 depending upon the aspects discussed in the analysis report.
Detailed analysis of the company including its past Financials, Issue Details, Client Base, Sector Outlook, future prospects, and many more. Also get SWOT analysis of the company and IPO evaluation classified as either Poor, Average, Good or Excellent.
Quick visual presentation of top stocks and mutual funds based on various fundamental and technical parameters like Top 5 Stocks Trading near Breakout Level, Top 5 Mutual Fund with Maximum Net Inflows.
List of stocks to watch out for during the week based on technical analysis. The stock list is updated every week and is an opportunity to identify stocks keeping the risk-reward ratio intact.
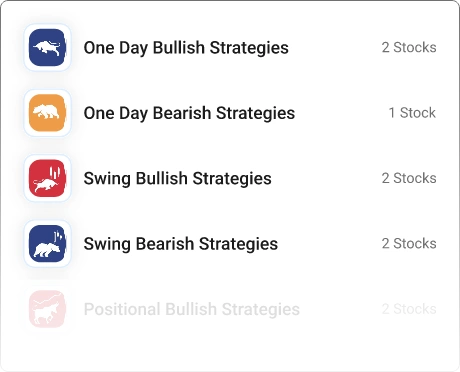
Identify quick opportunities to invest and trade with Predefined Combination scans segregated into specific categories which can help you to pick winning stocks.
Know the sentiment of the market by tracking the overall performance of the NIFTY 50 and NIFTY 500 stocks over different time periods with the help of RS 55, SMA, Advances & declines.